Statistics
Our Statistics
Beehive connects businesses seeking fast and accessible finance with investors who can fund their growth.
1
K+
0
Billion
1
K+
How Beehive financing has performed by year of origination
These charts show how financing originated by Beehive is performing across Term Finance (TF) and Working Capital Financing (WCF). This is shown by the year of origination (ie when they were written).
| Year | TF Net Yield | WCF Net Yield |
|---|---|---|
| 2014 | 11.66% | 0.00% |
| 2015 | 7.28% | 9.03% |
| 2016 | 10.14% | 9.95% |
| 2017 | 7.36% | 10.72% |
| 2018 | 6.59% | 10.59% |
| 2019 | 5.65% | 11.36% |
| 2020 | 9.65% | 11.35% |
| 2021 | 4.48% | 10.92% |
| 2022 | 8.11% | 10.84% |
| 2023 | 9.87% | 10.73% |
| 2024 | 13.15% | 10.67% |
| 2025 | 13.65% | 10.69% |
| All amounts are in AED, Million. Data as of 31st March 2025, the data will be updated at least on a quarterly basis. |
The returns are based upon the actual rate written and are updated when a financing line is defined as a default. We note that the net return for 2015 excludes one line which was covered by Beehive.
Information on finance written by year of origination
The table below provides additional information on the amount (aed) and number of financings that Beehive has originated by year. It also details the amount repaid to date and defaulted lines and NPLs (non-performing loans) which is defined as any line which is >90 days overdue but not classified as a defaulted line.
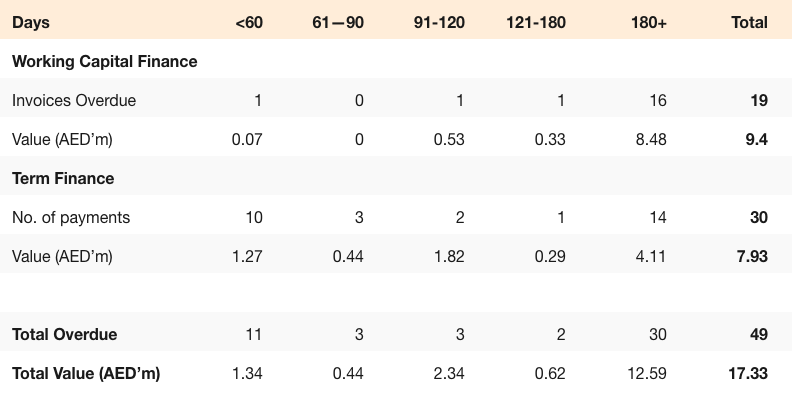
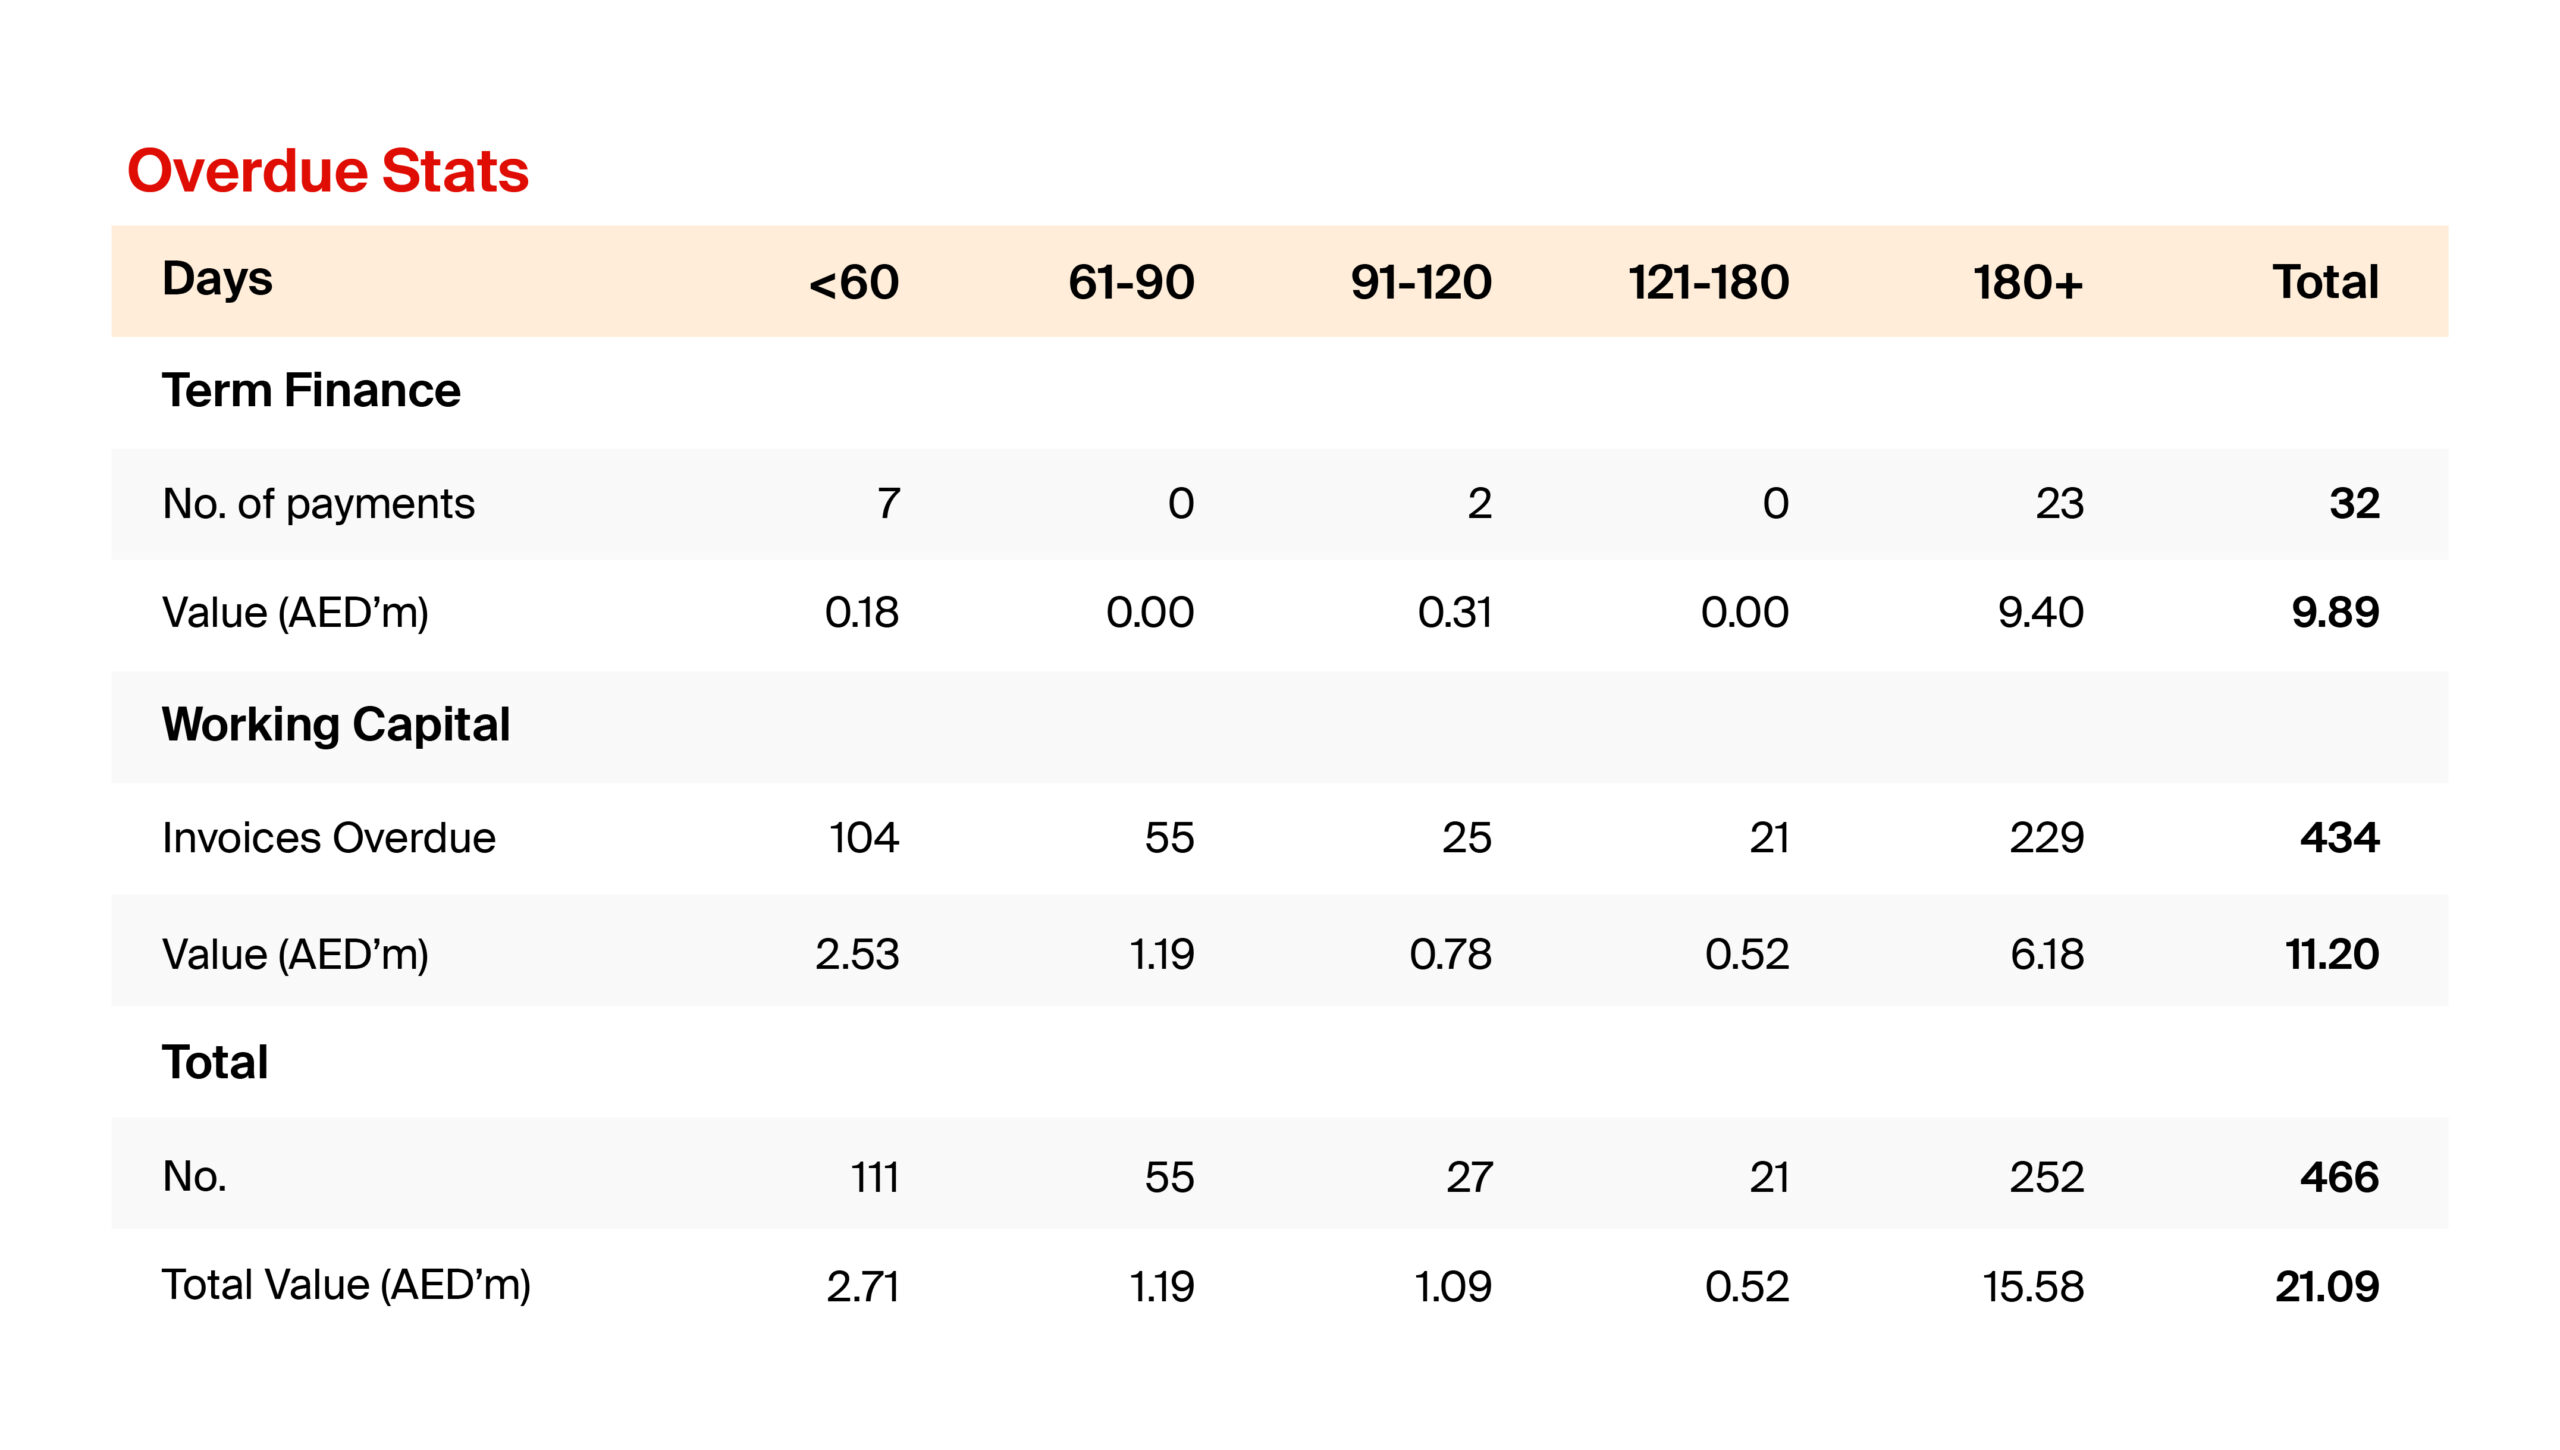
See a detailed summary of current NPLs here
| 2014-2020 | 2021 | 2022 | 2023 | 2024 | 2025 | Total | |
|---|---|---|---|---|---|---|---|
| Requests Financed | 14,303 | 3,655 | 4,526 | 6,198 | 4,967 | 1,147 | 34,796 |
| Amount Lent (AED mn) | 663.29 | 248.04 | 363.57 | 425.77 | 462.48 | 247.42 | 2,410.58 |
| NPL (AED mn) | 0.35 | 0.00 | 1.67 | 9.11 | 1.68 | 0.00 | 12.81 |
| NPL % | 0.05% | 0.00% | 0.46% | 2.14% | 0.36% | 0.00% | 0.53% |
| Default Amount (AED mn) | 10.15 | 8.35 | 3.67 | 4.61 | 0.00 | 0.00 | 26.78 |
| Default % | 1.53% | 3.37% | 1.01% | 1.08% | 0.00% | 0.00% | 1.11% |
| Principle Repaid % | 98.37% | 96.63% | 91.30% | 83.15% | 55.78% | 11.45% | 77.34% |
| All amounts are in AED, Million. Data as of 31st March 2025, the data will be updated at least on a quarterly basis. |
300
M+
300
M+
600
+
Actual and Forecast Bad Debt rate by risk band
The table below provides additional information about defaulted accounts. Our expected default rate (average default rate) is approximately c.0.9%. The expected default rate has been calculated by averaging the default rates over the four most recent complete years. This approach reflects the firm’s adoption of current funding and credit practices.
| 2020 | 2021 | 2022 | 2023 | 2024 | 2025 | |
|---|---|---|---|---|---|---|
| Defaulted accounts (%) | 1.53% | 3.37% | 1.01% | 1.08% | 0.00% | 0.00% |
| Defaulted accounts (No) | 4 | 8 | 3 | 2 | 0 | 0 |
| Data as of 31st March 2025. The data will be updated at least on a quarterly basis. |